OLAP Cubes
Dashboards can be designed to include OLAP cubes. OLAP cubes are data structures which can be manipulated by the report viewer to produce a wide variety of views of data. The following describes OLAP and how the report viewer can work with OLAP cubes.
Overview
OLAP (Online Analytical Processing) is a specific way to represent statistical data for executives, specialists and analysts. It is designed to aid in decision-making and better information understanding. The main idea is to answer the user’s questions, arising at the work time, on-the-fly, quickly. A popular definition is “A million spreadsheets in a box.” The key to OLAP is its ability to allow the end user to configure different views of the same data.
An OLAP system allows user to get into details and generalize, filter, sort and regroup data at the time of analysis. Intermediate and final totals are recalculated instantly.
The user is presented data in an electronic spreadsheet format. By moving rows and columns or clicking them, the user makes the system perform calculations and show data in different aspects. Thus, the user can produce many reports out of a single dataset on their own, without any assistance from IT specialists.
OLAP breaks data into two groups: facts (numbers, also called measures) and dimensions (descriptions). Facts (Measures) are aggregated in a given slice by some algorithm while the user defines grouping and aggregation depth by using Dimensions.
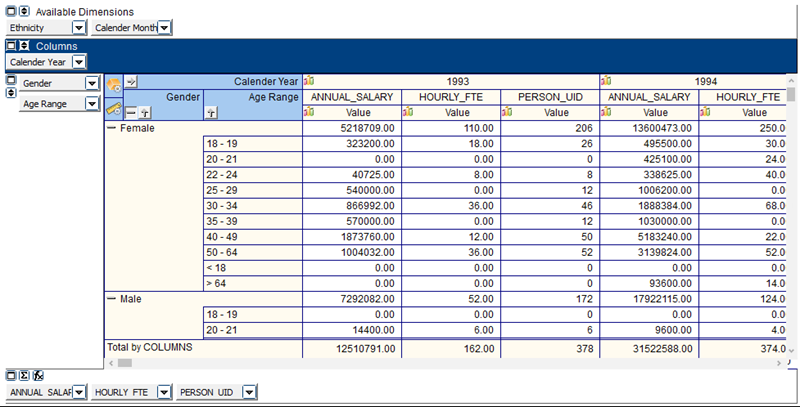
Tip: There are numerous resources available on the Web that discuss the underlying technology for OLAP cubes.
Measures
Measures are the numbers in the OLAP spreadsheet or cube. They can also be referred to as Facts. The Measures are displayed in the cells of the cube. Measures are stored in what are called Fact Tables.
Fact tables typically contain the following types of fields:
- Key fields to join the Fact table to Dimension tables.
- Measure fields containing numeric values.
Dimensions
Fields by which data records are grouped are called Dimensions. Dimensions can contain values of various types: strings, dates, numbers, and so on. A dimension lists members, all of which are perceived by the user to be similar types of data. A dimension is the answer to “How do you want to see your data.” For example, a Time dimension might include members for years, quarters, months, and weeks. A Sales dimension could include product names, sales territories, and names of salespersons. When running the cube, the end user can select to group the data by any or all the defined dimensions.
Dimensions have levels that allow for drilling down. For example, if looking at sales figures per quarter, you could drill down to get more information as to the makeup of the sales (such as products sold monthly in each region by each salesperson.
Dimensions can be pulled from the Fact Table but typically are stored in Dimension Tables. Dimension tables have the following types of fields:
- Key fields, used to join the dimension tables to the fact table (star schema).
- Level name fields, used to store the member names for the levels. For example, the Time dimension table could have a field called Month, which would have values such as January, February, March, etc.
- Level Order Key fields, used to store integer values used to order the members of the levels (if necessary). For example, the Time dimension table could have a field called Month Order Key, which could have a value of 1 for January, 2 for February, 3 for March, etc.
- Member Property fields, used to store the member property information. A Time dimension could have a field called Day Count, which would store the number of days for each month.